When a resources junior on the ASX releases a Feasibility Study, the market tends to gravitate toward the headline numbers: resource size, grade, mine life and headline NPV. These are the figures that move share prices in the first hour of trading. But they are rarely the numbers that determine whether a project is financeable, resilient or capable of generating sustained margins. The real economics sit in the cost structure, the operating assumptions and the physical realities of the orebody. These are the elements that shape cash flow, determine payback and ultimately decide whether the project becomes a mine or remains a study.
The seven factors below are the ones that matter most. Each maps directly to the core economic questions that sit behind every Feasibility Study. We call them ‘hidden details’ because they may not stick out at first glance, unless the company emphasises them which it only will if it is spectacular.
7 Data Points To Look For In a Mining Feasibility Study
1. Strip Ratio: How much does it cost to mine each tonne?
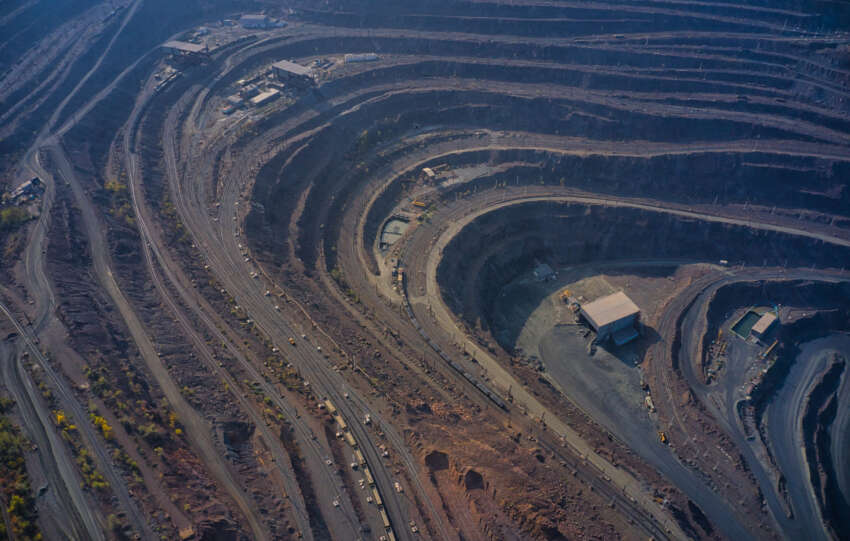
Strip ratio is one of the most powerful determinants of the cost of mining. A project with a strip ratio of 0.5:1 behaves very differently from one at 6:1, even if the grade is identical. The amount of waste that must be moved to access each tonne of ore drives fleet size, fuel consumption, labour intensity and haulage requirements. It also influences sustaining capital, because higher strip ratios require more frequent pushbacks and more extensive waste movement over the life of mine.
Early‑year strip ratio is particularly important. If the first five years of the mine plan rely on low‑strip material, the project generates stronger early cash flow, accelerates payback and supports a larger debt component. A low strip ratio is not simply a cost advantage; it is a financing advantage. It strengthens the entire capital structure.
2. Metallurgical Recovery: How much product do you get out of each tonne?
The grade of a resource is only meaningful if it can be recovered efficiently. Metallurgy determines how much of the in‑situ metal becomes saleable product, and the difference between 90% recovery and 65% recovery can be the difference between a robust project and a marginal one. Recovery also tends to vary across the orebody. A Feasibility Study that models uniform recovery across multiple domains should be treated with caution.
The complexity of the flowsheet matters too. A simple flotation circuit with predictable reagent consumption behaves very differently from a multi‑stage, energy‑intensive process with deleterious elements that require additional treatment. Projects with clean metallurgy and high recovery often outperform higher‑grade deposits with complex mineralogy. The market sometimes forgets this, but lenders do not.
3. Energy and Power Costs: How much does it cost to process each tonne?
Energy is often the largest single operating cost in a processing plant. The Feasibility Study should make clear whether the project is grid‑connected, reliant on diesel, supported by LNG or using a hybrid renewable system. Power price assumptions must be tested carefully, particularly for remote projects where diesel or LNG must be trucked in over long distances.
Processing cost per tonne is shaped by energy intensity, comminution requirements, water pumping distances and the efficiency of the plant design. A project with a modest grade but low energy intensity can outperform a higher‑grade project with a power‑hungry flowsheet. The energy strategy is therefore not a footnote; it is a core economic driver.
4. Logistics and Distance to Market: How far must the product travel?
Transport is one of the most underestimated cost components in mining. The Feasibility Study should detail haulage distance from mine to plant, plant to port, and port to customer. It should also clarify whether the product is shipped in bulk or containers, whether the port has capacity to handle the volumes and whether any upgrades are required.
A project located 1,000 km from port with no rail access will always struggle against a competitor 50 km from tidewater. Logistics can erode margins quietly but decisively. They also influence working capital, because longer supply chains require more inventory in transit. The best Feasibility Studies make these dynamics explicit.
5. Sustaining Capital: How much capital is required to keep it running?
Initial capex attracts the most attention, but sustaining capital often determines long‑term margins. Tailings lifts, equipment replacement cycles, ongoing waste stripping and infrastructure maintenance all shape the project’s cash flow profile. A project with low initial capex but high sustaining capital can be less attractive than one with higher upfront cost but lower ongoing spend.
The Feasibility Study should outline the timing and magnitude of sustaining capital, particularly in relation to tailings storage, mining fleet replacement and plant refurbishment. These costs are not optional. They are essential to keeping the operation running safely and efficiently. Investors who focus solely on initial capex risk misunderstanding the true capital intensity of the project.
6. Mine Scheduling and Grade Sequencing: How quickly does the project pay back?
The order in which ore is mined matters as much as the grade itself. A mine plan that brings forward high‑grade or low‑strip material strengthens early cash flow, improves NPV and increases the project’s ability to support debt. A mine plan that defers higher‑grade material until later in the life of mine weakens the financial case, even if the total resource is large.
Grade sequencing also interacts with metallurgy. If early ore domains have higher recovery or lower processing cost, the project benefits disproportionately. The Feasibility Study should make clear how the first five years of production look, because those years determine whether the project can be financed and whether it can withstand commodity price volatility.
7. Sensitivity and Downside Resilience: How sensitive is the project to cost inflation or lower prices?
The sensitivity table is often the most revealing part of a Feasibility Study. It shows how NPV responds to changes in commodity price, recovery, strip ratio, capex and opex. A robust project maintains positive economics under conservative assumptions. A marginal project collapses under modest changes.
Downside resilience matters because commodity cycles are unpredictable and cost inflation is structural in many jurisdictions. A project that only works at the top of the price cycle is not a project; it is an option. Investors should look for wide margins, conservative assumptions and a sensitivity profile that demonstrates resilience rather than fragility.
The real test of a Feasibility Study
A Feasibility Study may appear to be a highly detailed marketing document for an ASX resources junior. In some respects it is, but it is really a technical and financial blueprint. It is not enough to withstand scrutiny from investors, it needs to sway prospective lenders, strategic partners and operators. The headline numbers may attract attention, but the seven factors above determine whether the project can be built, financed and operated profitably.
Strip ratio, recovery, energy, logistics, sustaining capital, scheduling and sensitivity are the levers that shape margins. They are also the levers that determine whether the project can survive cost inflation, commodity volatility and operational complexity. A junior that understands these dynamics (and communicates them clearly) is far more likely to secure capital and progress to development.