ROIC: How useful is this metric and which 3 sectors generate the highest returns?
![]() Nick Sundich, April 18, 2023
Nick Sundich, April 18, 2023
ROIC, or Return on Invested Capital, is a financial metric used to measure a company’s efficiency in generating profits using the capital it has invested. It provides investors with an insight into how effectively a company is deploying its capital and whether it is generating high returns for its shareholders.
That’s it in a nutshell. But how is it calculated and which sectors tend to record the highest returns?
Do you need solid trading & investment ideas on the ASX? Stocks Down Under Concierge can help!
Concierge is a service that gives you timely BUY and SELL alerts on ASX-listed stocks – with price targets, buy ranges, stop loss levels and Sell alerts too. We only send out alerts on very high conviction stocks following substantial due diligence and our stop loss recommendations limit downside risks to individual stocks and maximise total returns.
Concierge is outperforming the market by a significant margin!
GET A 3-MONTH FREE TRIAL TO CONCIERGE TODAY
How ROIC is calculated
ROIC is calculated by dividing a company’s net operating profit after tax (NPAT) by its total invested capital. The NPAT is the profit that a company generates from its core operations after deducting the taxes paid. And total invested capital includes all the capital invested in the company, including shareholders’ equity and debt.
In general, a higher ROIC indicates that the company is generating higher profits using the capital it has invested, which is a good sign for investors. Companies that have a consistently high ROIC are often low-risk investment opportunities.
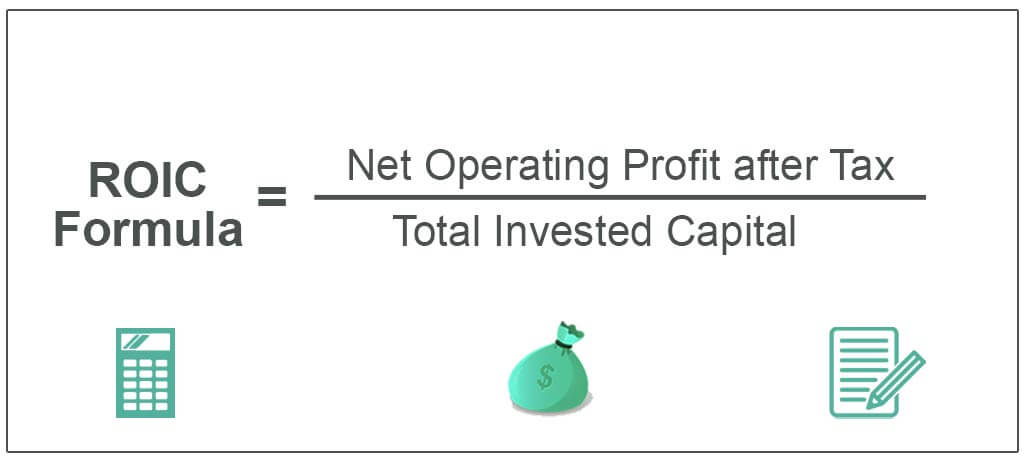
Source: WallStMojo
But returns can vary
However, it is important to note that ROIC can vary widely between companies, industries, and even time periods. To make accurate comparisons, it is important to compare a company’s ROIC with those of its peers in the same industry. Additionally, investors should look for consistent ROIC performance over time rather than just looking at a single period.
So what sectors have the highest ROIC?
One such sector is technology as companies in this field tend to invest heavily in innovation and research and development. This investment often leads to the creation of new and innovative products, which in turn positively impacts the company’s financial performance. The ASX tech stock with the best ROIC is TechnologyOne (ASX:TNE) with 41%.
The healthcare and pharmaceutical industries are also known for having high ROICs. This can be attributed to the fact that these companies invest heavily in research and development as well, with a focus on creating new drugs and medical devices that can improve patient outcomes. Furthermore, the healthcare industry is generally less affected by economic downturns, making it a relatively stable sector to invest in. One prominent example is radiology software stock Pro Medicus (ASX:PME), which has a ROIC of over 50%.
Finally, the financial services sector can also have high ROICs, particularly in areas such as wealth management and investment banking, because these companies often generate significant revenue from fees earned on assets under management or through successful investment strategies.
What are the Best ASX Sectors to invest in right now?
Check our buy/sell tips on the top Sectors in ASX

Disadvantages of using the ROIC metric
The ROIC metric has four shortcomings.
Firstly, it does not account for differences in tax rates across companies. A company with a low tax rate may appear to have a higher ROIC compared to a company with a higher tax rate, even if the two companies have similar investments and returns.
Secondly, it fails to consider differences in accounting standards across regions. Companies based in countries with different accounting standards may report investment and return figures differently, making it difficult to compare their ROICs.
Thirdly, it does not provide insights into the efficiency of a company’s operations. It only measures the returns generated by a company’s investments, without considering the costs associated with achieving those returns.
Lastly, it does not consider the risk associated with investments. Companies with higher returns may have taken on more risk, which may not be adequately reflected in this metric.
But ROIC is a very useful metric overall
ROIC is a powerful tool for investors looking to evaluate a company’s financial health and profitability. By understanding how to calculate and analyse this metric, investors can make informed decisions about where to invest their money. Nevertheless, it should be used in conjunction with other performance measures to provide a comprehensive picture of a company’s financial health.
Stocks Down Under Concierge is here to help you pick winning stocks!
The team at Stocks Down Under have been in the markets since the mid-90s and we have gone through many ups and downs. We have written about every sector!
Our Concierge BUY and SELL service picks the best stocks on ASX. We won’t just tell you what to buy – we give you a buy range, price target, a stop loss level in order to maximise total returns and (of course) we tell you when to sell. And we will only recommend very high conviction stocks where substantial due diligence has been conducted.
Our performance is well ahead of the ASX200 and All Ords.
You can try out Concierge for 3 months … for FREE.
GET A 3-MONTH FREE TRIAL TO CONCIERGE TODAY
There’s no credit card needed – the trial expires automatically.

Blog Categories
Get Our Top 5 ASX Stocks for FY25
Recent Posts

Your invitation to the Freelancer Investor Day
Your invitation to the Freelancer Investor Day Freelancer (ASX: FLN) is a Sydney-based company that has been the subject of…

Kamala Harris stocks: If Joe Biden’s VP wins the White House in 2024, which stocks will win?
With the US Presidential election now certain to be a Kamala Harris v Donald Trump showdown, we’ve looked at so-called…

South32 (ASX:S32): Is it the dark horse amongst ASX 200 miners or have cyclones and commodity prices hit it too hard?
South32 (ASX:S32) began life as a spinoff from BHP back in 2015, capitalised at $9bn. In mid-2024, it is capped…