Candlestick Patterns Every Trader Should Know

The skill to interpret price charts is a vital requirement for every serious market participant. To master it, you must look beyond the surface of the screen. Charts do not just show numbers. They show the collective will of thousands of people.
How Can You Read the Anatomy of a Candle?
You must understand the structure of a single candle first. Each candle represents a specific timeframe, like one hour or one day. In technical analysis, this candle summarizes all the market activity in that period through four key prices: open, high, low, and close (OHLC). The “real body” is the rectangle between the open and the close. If the close is higher than the open, the body is green. A lower close creates a red body.
Thin lines extend above and below the body. These are wicks or shadows. They show the price extremes for that period. The upper wick marks the highest price. The lower wick marks the lowest price. Analyze the relationship between the body and wicks. This helps you decide which side won the battle. A long upper wick shows that buyers tried to push prices up but failed.
The size of the body also carries a deep message. A long body shows strong momentum in one direction. In contrast, a short body shows a lack of conviction. If the body is small, neither side has a clear advantage. Therefore, the market waits for a new spark. You should always compare the body to the wicks. This comparison reveals the true strength of the trend for your trading strategy.
What Are the Most Important Single Candlestick Patterns?
Single candlestick patterns are simple but carry great weight. These signals often indicate a trend reversal or a brief pause.
-
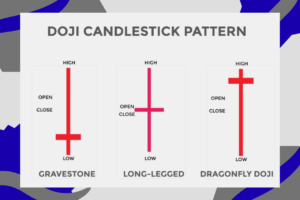
The Doji
The Doji is a famous example. It occurs when the open and close prices are almost identical. This creates a candle with almost no body. It shows a state of total indecision. Neither bulls nor bears have control.
A Doji often appears after a long move. It suggests that the current trend loses its steam. However, a Doji alone is not a signal to act. You must wait for the next candle to confirm the direction. If the next candle is large and red, the price may drop. If it is green, the trend might continue. For this reason, patience is a virtue in the trade with assets.
-
The Power of the Hammer and Hang Man
The Hammer is a bullish reversal pattern. It usually appears at the bottom of a downtrend. It has a small body and a long lower wick. This shape shows that sellers pushed prices down. However, buyers returned to push the price back to the top. It indicates that the sell-off is near an end. Therefore, traders use the Hammer as a signal that a price floor exists.
In contrast, the Hang Man looks like the Hammer but appears at a peak. This pattern is a warning sign after a long rally. It suggests that sellers now look for exits. The long lower wick shows that the market is vulnerable. Consequently, traders view this as a bearish signal. You must treat this candle with caution. It shows that the bulls lose their grip on the trend.
-
The Shoot Star and Invert Hammer
The Shoot Star is the bearish counterpart to the Hammer. It has a small body and a long upper wick. This pattern appears at the top of an uptrend. It signals that buyers failed to hold higher prices. When you see this, you know the bears rejected the bulls. This often leads to a downward move.
The Invert Hammer appears at the end of a downtrend. It is a bullish signal that indicates a trend change. The long upper wick shows some pressure from sellers. However, it also proves that buyers test higher levels. If the next candle closes higher, the reversal is certain. These signals work best near support or resistance.
Enter Double Candlestick Patterns
Double candlestick patterns are more complex and reliable. These formations use two candles to show momentum shifts.
-
The Engulf Pattern
The Engulf Pattern is an aggressive signal. A Bullish Engulf starts with a small bearish candle. A larger bullish candle then follows it. The second body completely covers the first one. This shows that buyers overwhelmed the sellers.
A Bearish Engulf is the opposite. It starts with a small green candle. Then, a large red candle covers it. This pattern suggests that the bears are now in control. It often marks the end of a price rise. For this reason, it is a favorite for those who sell short. You should look for this pattern at the end of a clear rally.

-
Piercing Line and Dark Cloud Cover
The Piercing Line is a bullish reversal in a downtrend. The first candle is long and bearish. The second candle opens lower but closes halfway up the first body. This indicates that bulls fight back after intense sales. It shows that bears lose their grip. Many traders wait for this before they enter a long trade.
The Dark Cloud Cover is a bearish reversal in uptrends. It starts with a strong bullish candle. A second candle opens higher but closes deep within the first body. This “dark cloud” suggests that optimism turned to pessimism. It is a sign that upward momentum fades. Traders use this to take profits or short the market.
These double patterns provide more context than a single candle. They show a shift in power over a longer period. Thus, they reduce the risk of a false signal. When the second candle closes, it confirms the change. You can then plan your entry with more confidence.
Speaking of confidence, strategic traders often seek out structured educational resources to refine their chart analysis skills. And a comprehensive candlestick patterns pdf containing the TOP-50 setups through dedicated educational platforms for traders ensures that a beginner has a reliable and professional reference to guide their decision-making process.
These platforms offer high-quality insights that help bridge the gap between theoretical knowledge and real-world application. When you have a curated list of patterns, it allows you to identify high-probability setups in trading sessions.
Why Do Triple Candlestick Patterns Offer More Certainty?
Triple patterns offer more certainty because they have more data. These formations use three candles to confirm a trend change.
-
The Morning Star
It is a well-known triple pattern, which starts with a long red candle. A small candle follows it, then a long green candle ends the set. The middle “star” signals a shift to a bull market.
To identify a valid Morning Star, look for these three criteria:
- A long bearish candle confirms the current downtrend is strong.
- A small-bodied candle shows that momentum slows and indecision enters.
- A long bullish candle proves that buyers take control of the session.
2. The Evening Star and Three White Soldiers
The Evening Star is the bearish version of the Morning Star. It consists of a large bullish candle, a small star, and a bearish candle. This tells us that bulls are tired. Thus, bears are ready to take over. It is an excellent signal to find the end of a rally. Traders often exit their long positions here.
The Three White Soldiers pattern has three long green candles. Each candle opens within the previous body. This suggests a steady advance that will likely continue. Conversely, Three Black Crows feature three long red candles. Each candle opens within the previous body and closes lower. This is a bearish sign of a major sell-off. These patterns show that a trend gains strength.
Comparison of Common Bullish and Bearish Patterns
| Pattern Type | Bullish Signal | Bearish Signal |
| Single Candle | Hammer | Shoot Star |
| Single Candle | Invert Hammer | Hang Man |
| Double Candle | Bullish Engulf | Bearish Engulf |
| Double Candle | Piercing Line | Dark Cloud Cover |
| Triple Candle | Morning Star | Evening Star |
| Triple Candle | Three White Soldiers | Three Black Crows |
How Can Traders Use These Patterns Effectively?
Recognition is only half of the battle. Beginners often trade every pattern they see. However, pros use these signals as part of a strategy. You must consider the market context first. Is the market in a trend or a range? Patterns work best at key price levels like support or resistance.
Furthermore, you must avoid the hunt for patterns in a messy market. If the price moves sideways, signals are less reliable. Wait for a clear trend to develop first. A Hammer at the bottom is worth more than a Hammer in a flat range. Consequently, location is as vital as the shape itself. You should also check different timeframes to confirm the view.
Confirmation and Risk Management
Is confirmation necessary before you enter a trade? Most successful traders say yes. Confirmation means you wait for the next candle to close. If you see a Morning Star, wait for a break above its high. This reduces the risk of a “fakeout.” In a fakeout, the price reverses briefly before it continues the trend.
Follow these steps for a disciplined approach:
- Ensure the pattern appears after a clear move
- Verify that the candle shapes match the definitions
- Look for the next price action to move in your favor
- Set a stop-loss order to protect your funds.
Risk management is the key to a long career in the market. Even the best patterns fail at times. Therefore, you must never risk too much on one setup. Use the lows or highs of the pattern to set your exit. This ensures that a single loss does not end your progress. Over time, the math of good setups will favor you.
Can Candlestick Patterns Be Used in All Markets?
These patterns work for stocks, forex, and crypto. This is because candles track human behavior. Fear and greed look the same on every chart. Once you master these cues, you can trade any liquid market. However, you must know specific market details. Stocks often have price gaps, but forex does not.
In the stock market, news often breaks after the close. This causes the price to jump or drop the next morning. These gaps are a part of patterns like the Morning Star. In the forex market, the trade never stops for five days. Thus, gaps are rare. You must adapt your rules to the asset you choose. Despite these small shifts, the core logic of the candles remains firm.
In conclusion, candlestick patterns provide a window into the market. They turn data into a story of triumph and defeat. If you learn these formations, you gain an advantage. You will no longer trade without direction. Instead, you will understand the flow of the market. Success in the trade comes to those who study the charts with care.
Blog Categories
Get the Latest Insider Trades on ASX!
Recent Posts

Cassius Mining (ASX:CMD) The $905m Claim That Just Repriced the Stock
Cassius Mining, What Actually Happened Cassius Mining filed its Reply to Ghana’s Defence Memorial on 31 March 2026 in the…

Lindian Resources (ASX:LIN) Oversubscribed $100m Placement De-Risks Kangankunde
Lindian Resources $100m Raise, Stage 1 Now Debt-Free Lindian Resources has just raised A$100M through an institutional placement at 70.5…

AML3D (ASX:AL3) A$16.6m H2 Pipeline, First Proof Point Just Landed
AML3D Delivery Done, Cash Unlocks in H2 Investors are moving back into tech stocks today, and AML3D has added to…