Strap in because we see the NASDAQ fall to 9,700
![]() Marc Kennis, July 21, 2022
Marc Kennis, July 21, 2022
At Stocks Down Under we love our Technology stocks. And with the recent bullishness in this sector, we thought we’d have a look at the NASDAQ Composite index in the US to see if the worst of the Tech Crash is now over. We do that using Elliot Wave Theory, a tried and trusted Technical Analysis tool.
No time to do stock research, but you still want to invest?
Stocks Down Under Concierge gives you timely BUY and SELL alerts on ASX-listed stocks!
GET A 3-MONTH FREE TRIAL TO CONCIERGE TODAY
What’s the Elliott Wave Theory?
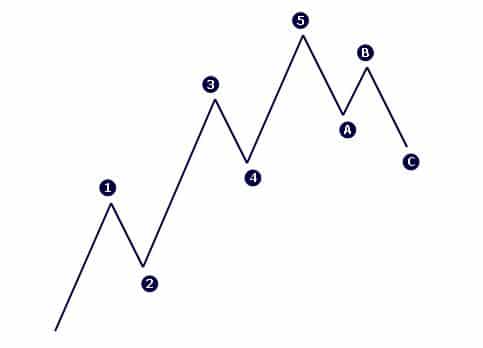
The Elliott Wave Theory suggests that moves in the direction of the main trend take place in five impulsive waves (named 1, 2, 3, 4, 5), followed by three corrective waves in a counter-trend move (named A, B, C). The following image shows what a simple Elliott wave count should look like on a chart.

A simple Elliot Wave Pattern
There are several rules governing the Elliot wave patterns that make counting waves possible for Elliot wave practitioners. For example, some of these rules are that wave 3 can’t be the shortest of waves 1, 3 and 5 and wave 4 can’t dip into wave 1 (in an uptrend pattern).
Counting Elliott waves on the NASDAQ Composite Index
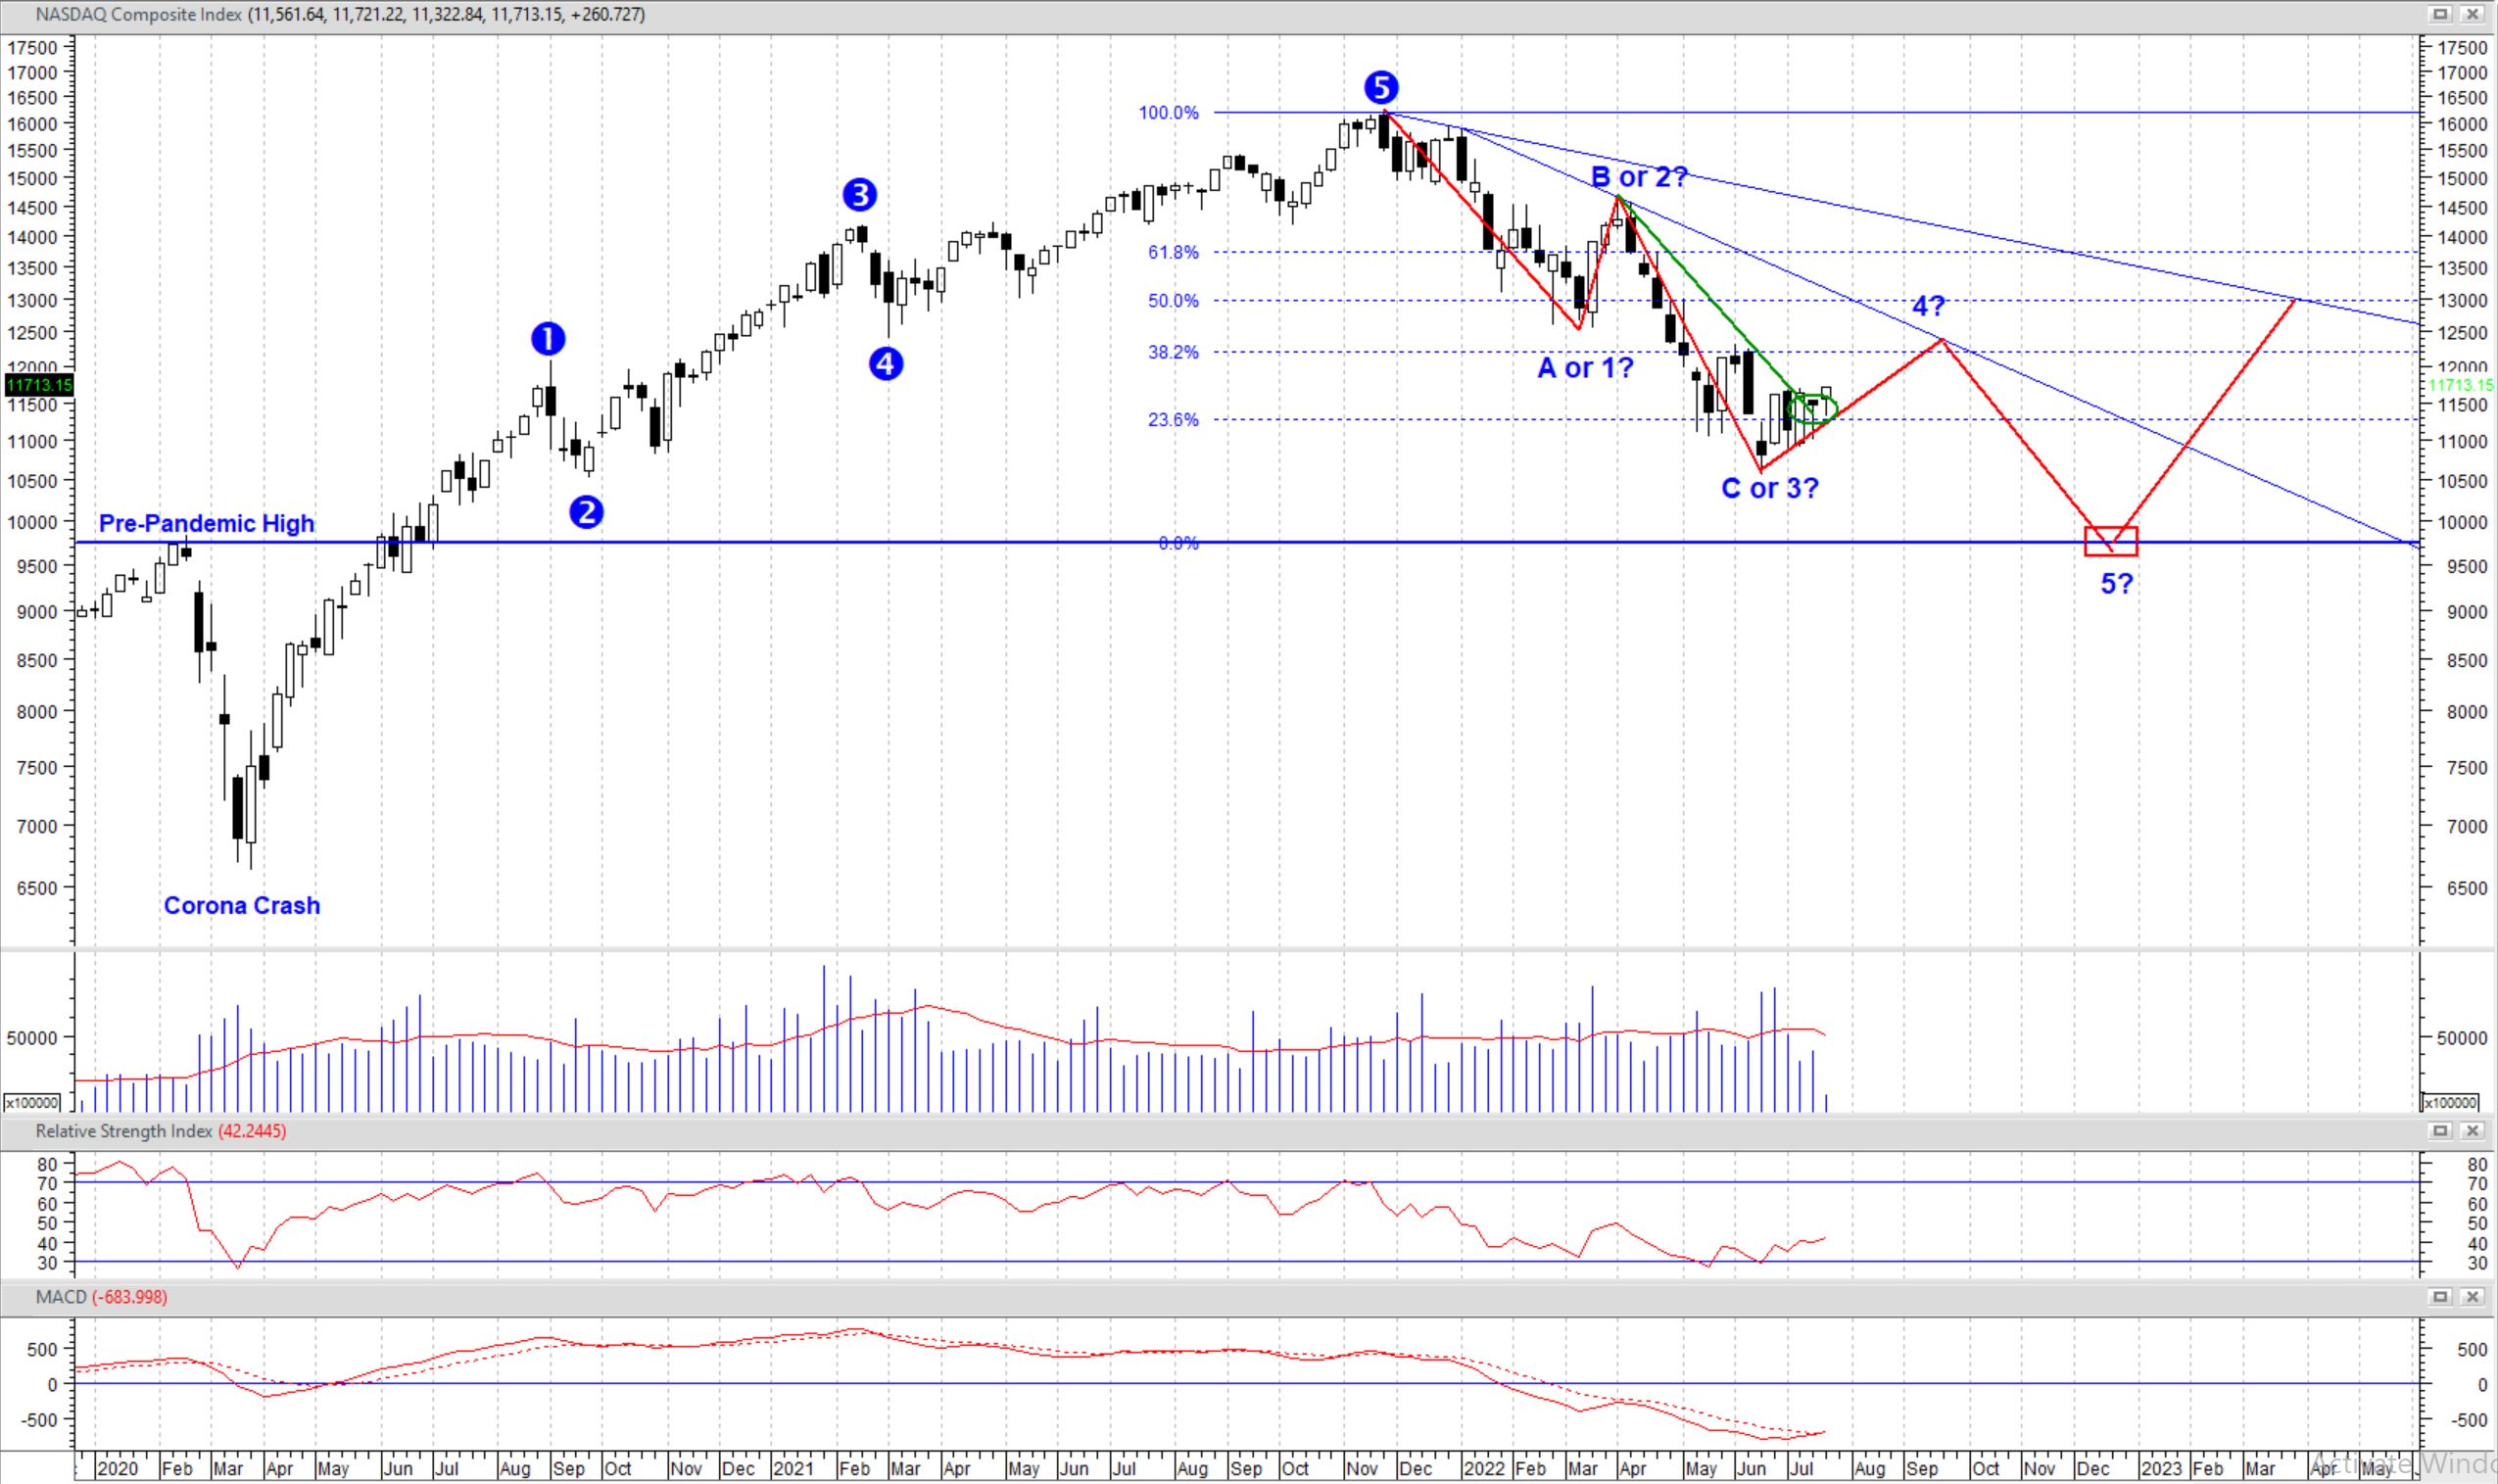
The following image shows our suggested Elliott wave count on the NASDAQ Composite Index chart.

The NASDAQ Composite Index, Weekly chart (Source: Metastock)
Generally, wave C travels the same distance as wave A and it should’ve ended somewhere near 11400 (the green circle). But the fact that wave C extended beyond the length of wave A increases the possibility for an alternative wave count that suggests the current downtrend as the main trend and not just a counter-trend move.
NASDAQ at 12,400 by mid-September
Based on this alternative wave count, the NASDAQ index is in wave 4 with a target of around 12,400 by mid-September (calculated by adding the length of wave 2 to the end point of wave 3), which brings the index to the downward trendline once more before starting the wave 5.
Final leg down to 9,700 by December 2022
Wave 5 would be the final leg down for the current downtrend and has a likely target of around 9,700 (calculated by adding the length of wave 1 to the calculated target of wave 4), which coincides with the index’s pre-pandemic high level. At that point, we can expect the index to start a significant rally to recover to the 50% Fibonacci retracement of the downtrend at 13,000.
How does the Elliott Wave Theory make sense from an economic perspective?
Some researchers on the subject of market cycles argue that it’s not always the underlying economic facts that form the market cycles and that this relationship goes both ways. Explaining the economic drivers of Elliott waves in the NASDAQ chart in the last several months will help to better understand this argument.
Wave 1 started after the market peaked in November 2021 on fears that the pandemic is over on the back of the global vaccination roll-outs and that the Fed would soon start to unwind its Quantitative Easing policy.
Wave 2 took place after the Fed responded to the market’s concerns and signalled confidence in its ability to perform a soft landing for the economy.
Wave 3 took place after international sanctions on Russia’s economy and renewed lockdowns in China increased doubts about the Fed’s ability for a soft landing, especially with inflation spiralling out of control in the US.
Wave 4 is forming as recession fears are expected to lower the Fed’s pace of interest rate hikes as well as better than expected corporate earnings.
Where to now?
Now guess what happens when wave 4 reaches our target of 12,400 after adding a 17% gain to its low of 10,600 (the end point of wave 3)? The Fed will most likely come out saying that the economy is showing extreme resilience and corporate earnings are very strong and we can and must aggressively increase the interest rates to tame the 40-year high inflation rates. We expect this may kick-start wave 5, potentially down to 9,700.
NASDAQ is still on a primary downtrend
The recent gains in NASDAQ are due to US corporate earnings coming in better than lowered expectations as well as the aforementioned Fed’s response to the increased fears of recession. The Fed is now signalling a 75 basis point increase in interest rates in the upcoming Fed meeting later this month, rather than the initially expected 100 basis points hike.
But we don’t think these gains in NASDAQ can be consolidated. The macroeconomic picture is still too bearish.
We’re in a bear market rally right now
Although most corporate earnings are coming in stronger than expected, they are falling on a year-over-year basis. China’s economic growth is faltering due to its zero COVID policy that has put the country in an endless cycle of lockdowns and the war in Ukraine is adversely impacting Europe’s economy. High inflation is persisting and the Fed is maintaining its tightening policy.
All that brings us to a conclusion that the underlying economic facts agree with our technical analysis that there’s likely more downside to the NASDAQ Composite Index and stock markets overall, including the ASX.
No time to do stock research, but you still want to invest?
Stocks Down Under Concierge gives you timely BUY and SELL alerts on ASX-listed stocks!
GET A 3-MONTH FREE TRIAL TO CONCIERGE TODAY
No credit card needed and the trial expires automatically.

Frequently asked questions about the NASDAQ Composite Index
- What is the NASDAQ Composite Index?
The NASDAQ Composite Index is a US stock market index heavily weighted towards companies in the IT sector.
- Why is the NASDAQ Composite Index in green recently?
The recent gains in the NASDAQ index are due to better-than-expected corporate earnings as well as a less than previously expected hawkish Fed.
- Can I buy or sell the NASDAQ Composite Index?
There are a number of index funds that track the NASDAQ Composite Index, such as Fidelity Investments, as well as exchange-traded funds, such as the Nasdaq: QQQ ETF, which matches the performance of the NASDAQ 100.
Blog Categories
Get Our Top 5 ASX Stocks for FY25
Recent Posts
Trump vs. Jerome Powell: What Happens to the Market If Powell Is Fired?
The relationship between President Donald Trump and Federal Reserve Chair Jerome Powell has often been tumultuous, particularly around decisions regarding…
Telix Pharmaceuticals (ASX:TLX): It’s made ~A$1.7bn in revenue from Illucix, but here’s why the best is yet to come!
What would you have thought if you were told 5 years ago you would see Telix Pharmaceuticals as a successful…
Anti Woke ETFs: Do they practice what they preach and have they outperformed since Trump’s return to power?
Have you ever heard of so-called ‘Anti Woke ETFs’? If you’re sick of companies that are big on ESG, this…


